
Fargo Ratings
What are they? Where did they come from? What do they mean?

For those pool players playing outside of the APA, chances are you play in a league that uses Fargo ratings. (At least if you’re in the USA.)
What is a Fargo Rating?
A Fargo Rating is a number that gives you some idea of how good you are at pool (8 ball, 9 ball and 10 ball only) relative to other players with a Fargo Rating. It is derived from the ELO system used in chess.
The people behind Fargo Ratings will give you some detail about it, but not enough for people like me.
Your Fargo will probably be somewhere between 200 and 800, with the vast majority of players on the lower end of the scale. If you just want a simple rule of thumb, here is it is:
A Fargo Rating difference of 100 points means the higher player beats the lower player 66.7% of the time.
Where do Fargo Ratings come from and What do they mean?
Fargo uses a few different equations, but one of the most useful is the one to determine odds of winning a single match. That formula is here:
Now, before you bail on me, this formula is pretty simple. If you put 100 in there for FargoDifference, you’ll get 66.7%.
Here’s what that formula looks like if you plot it from zero difference to 600 points:
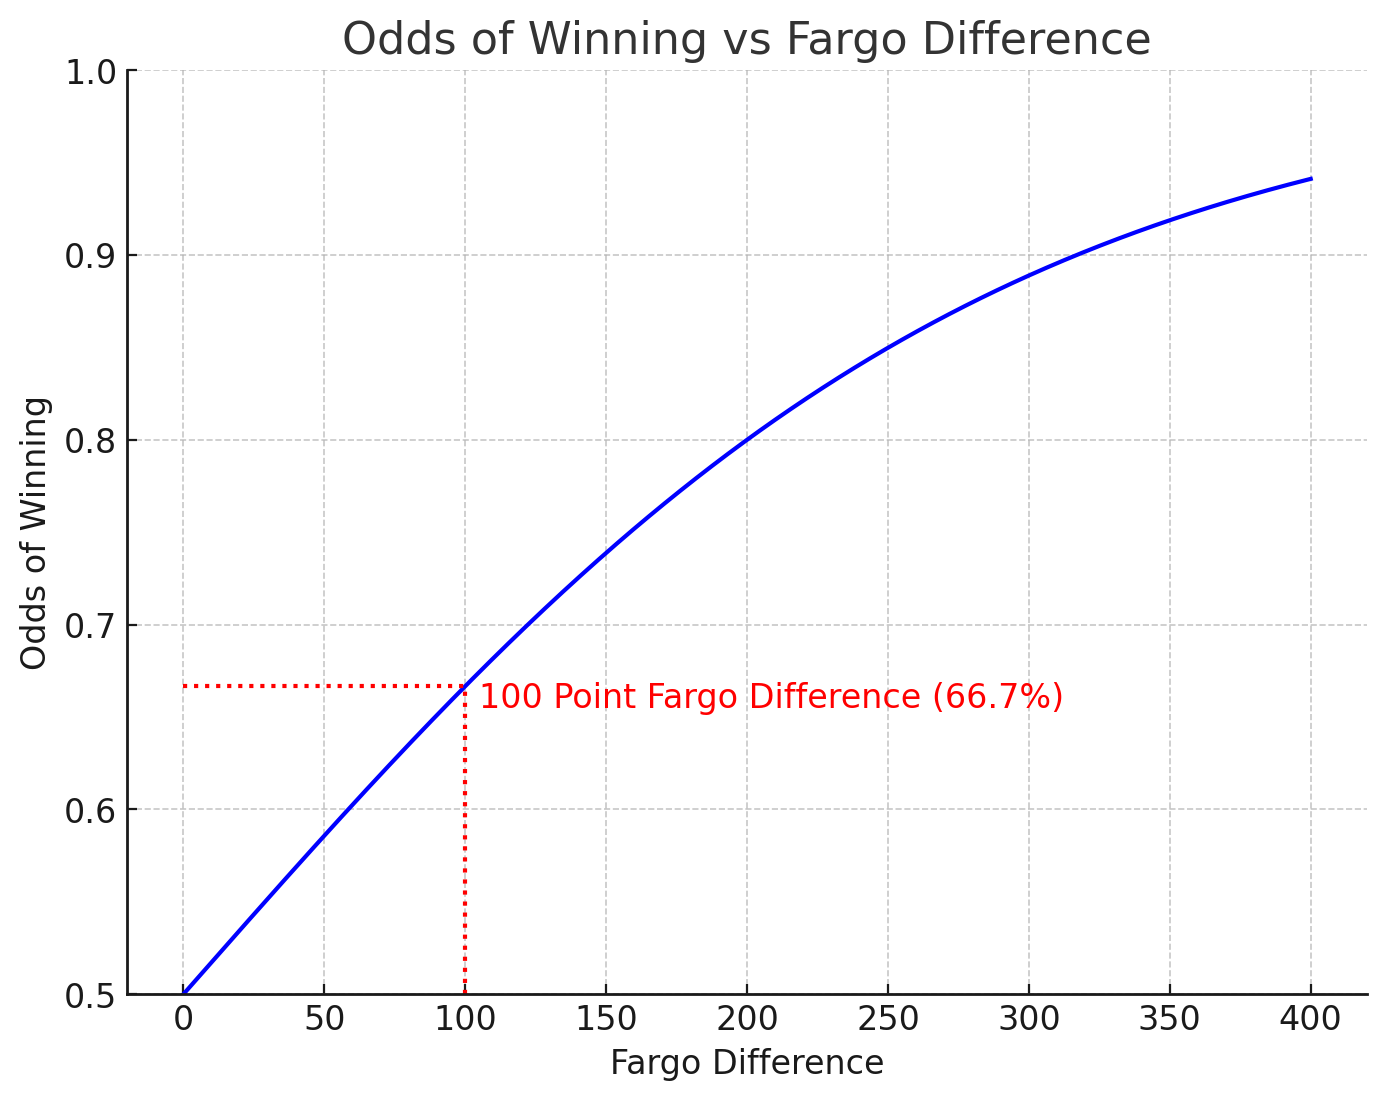
You can see at a difference of zero, your odds of winning are 50%. That makes intuitive sense. At about 317 points, the higher ranked player has a 90% chance of winning a single game.
As the difference in Fargos gets larger, eventually the odds of winning for the higher ranked player approach 100%.
As of this writing, the highest ranked player in the world is Joshua Filler at a Fargo Rating of 850. If Joshua were to play the lowest ranked player in your typical league at say, 200, his odds of winning that single game are 98.8%. Getting close to 100%. My chart doesn’t go out that far because you’re very unlikely to witness a matchup like that.
In practice, these numbers are used two ways:
Live Pro Matchs Odds
You might have seen this in some matches. At the bottom of the screen it will show the approximate odds to win as the games tick down. I’m not seeing this as much as I used to simply because MatchRoom is growing and they don’t use it. (MatchRoom uses winnings. It makes sense, but it isn’t as much fun in my opinion. That’s a post for another day)
When you do see live odds, here’s how it’s done
Let’s say Joshua Filler (850) is playing Fedor Gorst (844) in a race to five. Joshua is a 51% favorite to win a single game. Let’s say he’s up 3 games to 2. That means he needs to win 2 more games before Fedor wins 3.
He has a few difference ways to do that: ( Remember he already has 3 in this scenario.)
Win 2-0 (WW)
Win 2-1 (LWW, WLW)
Win 2-2 (LLWW, LWLW, WLLW)
Each of those things has a probability of happening:
Win 2-0 (26%)
Win 2-1 (12.7%, 12.7%)
Win 2-2 (6.2%, 6.2%, 6.2%)
If you add all those up, it’s 70.3%. That’s what you’d see on the screen once Filler wins his third game and Fedor has 2.
Handicap Your League Match
This one is a little more complicated and deserves it’s own post. I’ll tackle that next.